2023 State of the Workforce
Introduction
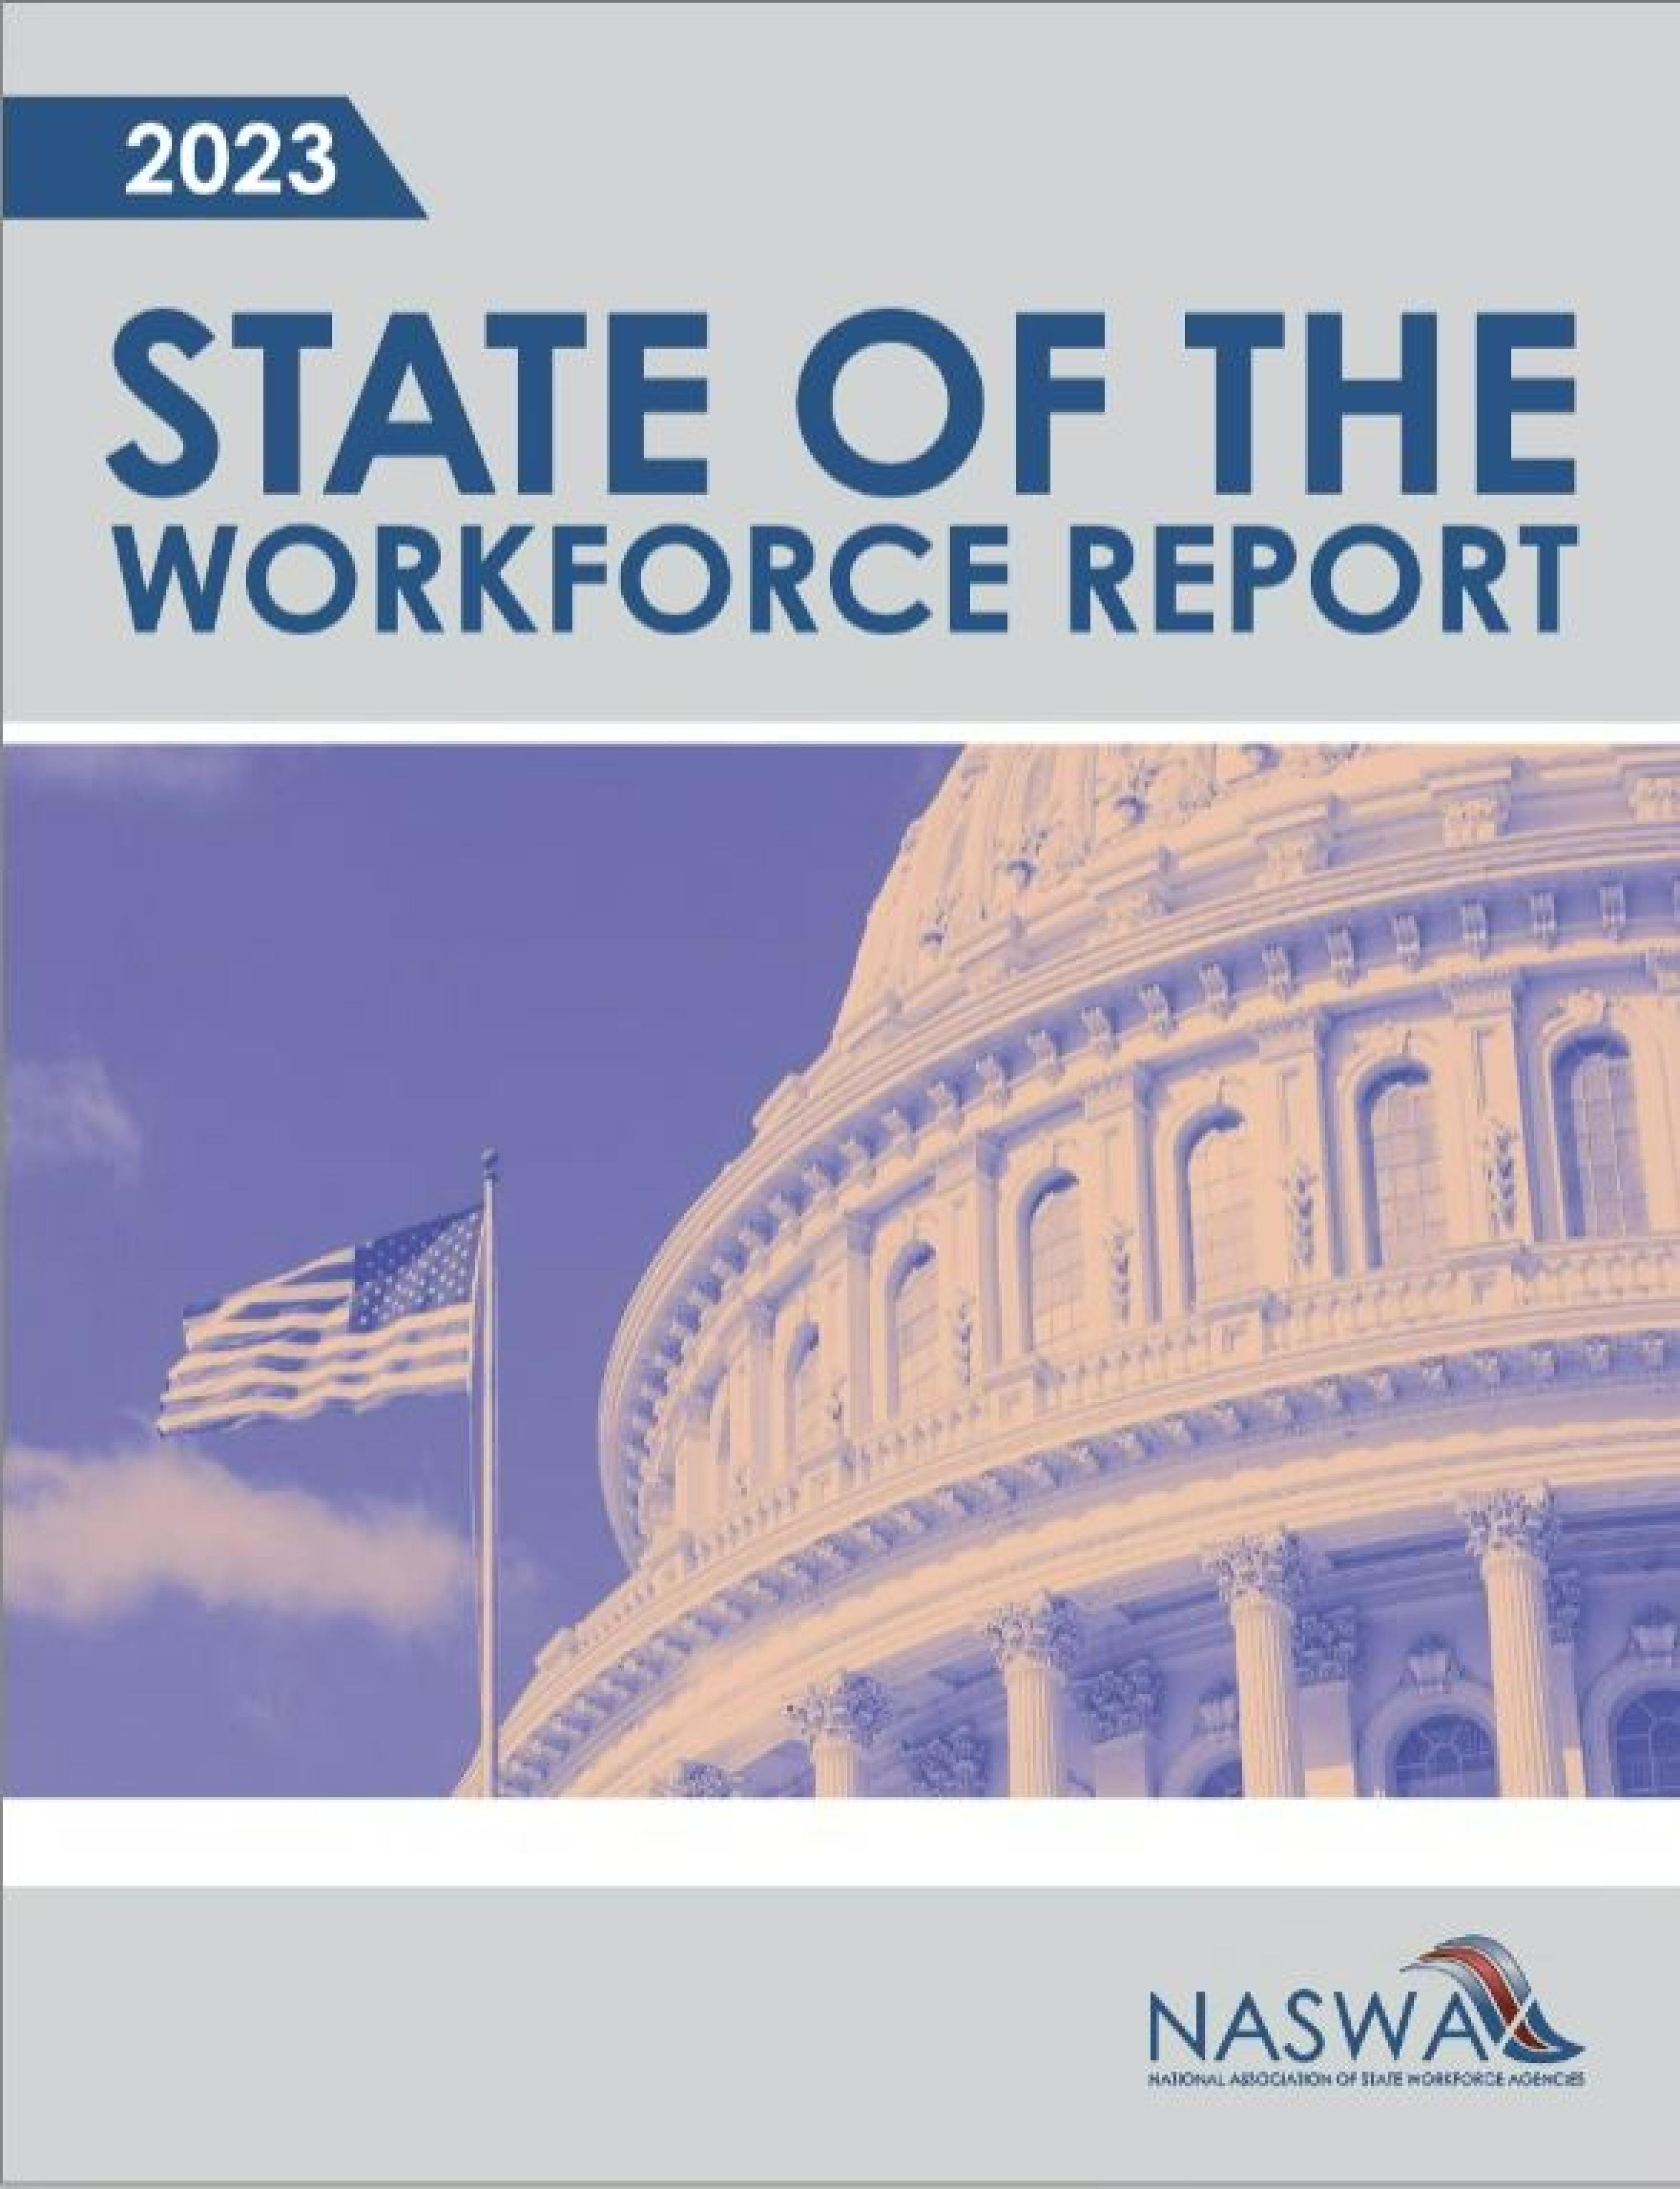
The National Association of State Workforce Agencies (NASWA) is proud to present the 2023 State of the Workforce Report. In its third iteration, the report brings together data and key innovations from the nation’s state workforce agencies into one cohesive report. NASWA appreciates the state contributions to this effort, as well as the data provided by the Bureau of Labor Statistics at the U.S. Department of Labor.
Each state profile includes:
- State workforce innovation highlights
- Labor market information for residents 16 and older including:
- Annual labor force participation rate
- Year-over-year change in job growth (April 2022-2023)
- Annual average unemployment rate
- Annual average labor force
- Percent change of jobs in the state relative to a pre-COVID baseline (February 2020 vs April 2023)
- Year-over-year change in total wages (QCEW Q4 2021 – Q4 2022)
- Programs within the state workforce agency
- Workforce Innovation and Opportunity Act (WIOA) core programs and the administering agency for the state
- Number of workforce development regions and American Job Centers within the state
- Number of participants served
- Education levels for residents age 25 and older
- Top three industries based on average annual job growth at the super sector level data
- Unemployment Average number of weeks people receive unemployment insurance
- Percentage of individuals receiving unemployment benefits who use all the eligible weeks without finding new employment
How to Download
Full Report: For a national perspective on the State of the Workforce, click the button to the right to download the full report, complete with an interactive table of contents and executive summary.
